
ACCORDING to social services minister Kevin Andrews, the latest figures from his department show that one-in-five Australians received some form of government income support in 2012, at a cost of over $70 billion. The minister described the level of welfare as “unsustainable” and “relentless” and said that more must be done to reduce the burden on the federal budget. He highlighted two areas for attention – the disability support pension, or DSP, and Newstart, the payment for the unemployed – and announced that the review of the welfare system will now report at the end of February.
The number of people receiving those two payments certainly seems to have grown significantly over the past five years: from 714,000 in 2007 to 827,000 in 2012 in the case of the DSP, and from 486,000 to 634,000 for Newstart and unemployed recipients of the youth allowance. Even more strikingly, recent labour-force figures show another large jump in the number of people receiving unemployment payments to just over 800,000 in mid 2013.
What explains these trends? Are they likely to continue “relentlessly” and do they mean that the system has become “unsustainable”?
Where to start?
To understand the changes in welfare numbers, we need to consider a range of factors, including Australia’s growing population and evolving demographic composition, trends in the labour market, and the impact of government policy changes in other parts of the welfare system. Part of the explanation is also likely to involve the way individuals respond to changing incentives within the welfare system. We also need to take a longer-term perspective, using Department of Social Services statistical reports going back to 1991 and data collected by its predecessor departments since the 1960s.
Because the Australian population has grown quite significantly over time, the best way to track the trends is to look at the number of people receiving payments as a percentage of the working-age population – people aged between sixteen and sixty-four years.
Chart 1 shows the proportion of people in this group receiving income-support payments between 1976 and 2012. After rising steadily in the late 1970s, the figure jumped significantly in the early 1980s, declined in the second half of the 1980s, then jumped again in the early 1990s. From 1996 onwards there was a long steady decline, with a more modest rise and fall since 2008.
Chart 1: Trends in per cent of working age population receiving income support payments, Australia, 1976–2012
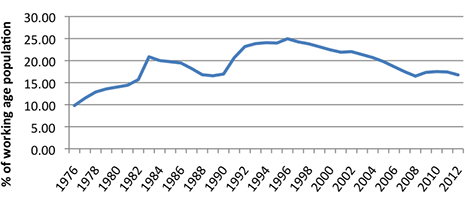
Note: Working age is defined as the population aged 16 to 64 years. Source: Calculated from Department of Social Services, Income Support Customers, A Statistical Overview, various years and Australian Bureau of Statistics, Australian Demographic Statistics, June 2013.
What explains these fluctuations? The number of working-age people receiving welfare payments at any one time is strongly related to the state of the labour market. Not surprisingly, it increases significantly in periods of recession. Unemployment was generally below 2 per cent of the labour force up until the 1970s, but doubled to 4.6 per cent between 1974 and 1975, and then rose to over 6 per cent in 1978. The recession of the 1980s saw a peak unemployment rate of 9.9 per cent in 1983, followed by a decline through to 1989. In the midst of another recession, it increased to 11 per cent in 1993. Unemployment declined after 1993, falling to 4 per cent, the lowest level since 1974, in February 2008.
But other factors are at work as well, including the dynamics of different categories of payments. Changes in the number of lone parents receiving benefits, for example, partly reflect shifts in family formation. People who are unemployed for lengthy periods and experience a disability may drop out of the labour market and end up on the DSP, for example, and unemployment can lead to family breakdown and growing lone parenthood.
Nor does the number of people receiving welfare payments necessarily fall as rapidly as the unemployment rate. The most commonly cited reason is that long-term unemployment leads to a deterioration in skill levels and morale, which reduces the intensity of an individual’s search for a job. This can lead to higher wage pressures at a given rate of unemployment, lifting the rate of unemployment towards which the economy tends. Between the 1970s and the 1990s, unemployment in Australia “ratcheted-up” after recessions but didn’t return to its pre-recession levels afterwards – and the people who gained jobs during those recoveries were not necessarily the people who had lost jobs during the recessions.
Policy changes are also a major cause of changes in the number of welfare recipients. In periods when benefits are more generous or easier to access, the number of recipients tends to grow, while periods of tighter eligibility or entitlement conditions have the opposite impact.
Reflecting these and other factors, the proportion of people receiving welfare payments peaked at nearly one in four of the working-age population in 1996, before falling to one in six in 2008, just before the global financial crisis. After the GFC, the proportion of working-age people receiving benefits rose to 17.4 per cent in 2010, then started to fall again, reaching 16.9 per cent in 2012 – not quite back to the 2008 level, but the second lowest level in the past two decades.
Chart 2 breaks down trends since the late 1980s, showing what has happened to the share of the working-age population receiving the DSP, the share receiving unemployment-related payments, and the percentage receiving any other form of working-age income support, including lone parents, the sick, carers and recipients of student assistance.
Chart 2: Trends in per cent of working age population receiving income-support payments, Australia, 1989–2013
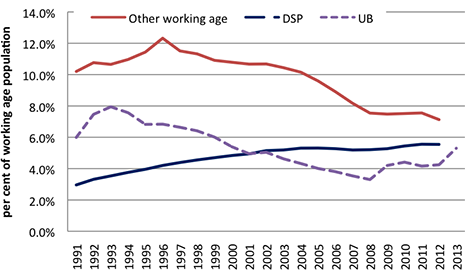
Note: Working age is defined as the population aged 16 to 64 years. Source: Calculated from Department of Social Services, Income Support Customers, A Statistical Overview, various years; Department of Social Services, Labour Market and Related Payments, and Australian Bureau of Statistics, Australian Demographic Statistics, June 2013.
A fairly steady rise in the number of people on the DSP is apparent, as is an initial rise in the number of unemployed, followed by a decline until the GFC, and a sharp increase in 2008–09 and 2012–13. What is most striking, however, is the trend in the number receiving other payments; this peaked at 12.3 per cent of the population in 1996 but continued to fall to 7.1 per cent by 2012.
Chart 3 shows changes in the number of people receiving specific payments between the 1996 peak and 2012. It highlights the fact that the reduction of approximately 250,000 in the total number of working-age people receiving payments is the product of an increase of around 330,000 people receiving the DSP and 180,000 receiving the carer payment and a small number of widow allowances, figures that are more than completely offset by declines in all other forms of income support.
Chart 3: Changes in numbers of people receiving income support payments, Australia, 1996–2012
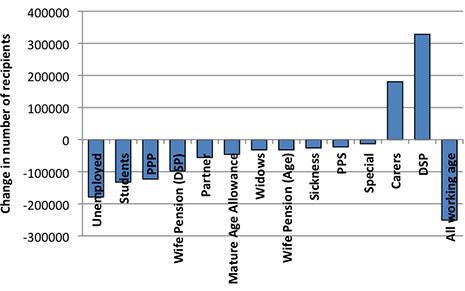
PPP: Parenting allowance (partnered); PPS: Parenting payment (single)
Source: Calculated from Department of Social Services, Income Support Customers, A Statistical Overview, various years.
While the decline in the number of people receiving unemployment payments (180,000) is the largest single component of these declines, the cumulative effect of the declines in other payments is much larger (465,000). While the improvement in labour market conditions after 1996 certainly contributed to the decline in numbers on these other payments, policy changes – discussed below – appear to be the most important factor behind these falls in welfare receipt.
1996 and all that
With fewer people receiving assistance from just about all income support programs after 1996, why are DSP and carer payment numbers rising?
The state of the labour market is part of the answer, and so are two other factors that have had a major impact among people of working age: the ageing of the baby boom generation and the major social security policy reforms introduced by Australian governments over the past two-and-a-half decades.
It’s well known that the Australian welfare system – like those in other welfare states – will face pressures from the ageing of the “baby boom generation” in coming decades. But the boomers’ impact on DSP numbers started to be significant nearly twenty years ago. Receipt of the DSP is strongly age-related, mainly because the incidence of disability rises with age. In 2012, for example, about 1.7 per cent of people aged sixteen to twenty received the DSP, but this rose to 2.2 per cent among people in their twenties, 3.1 per cent in their thirties, 5.4 per cent in their forties, 9.0 per cent in their fifties and close to 15 per cent of those aged sixty to sixty-four.
This is important because the age structure of the Australian population has changed significantly over the past two decades as a result of the ageing of the baby boom generation, conventionally dated to those born between 1946 and the early 1960s. Up until 1996, demographer Natalie Jackson has shown, changes in the age structure of the Australian population acted to slow the growth of the DSP. But people born in 1946 started to turn fifty in 1996, reversing that slowdown.
Chart 4: Change in number of persons sixteen and over by age, Australia, 1996–2013
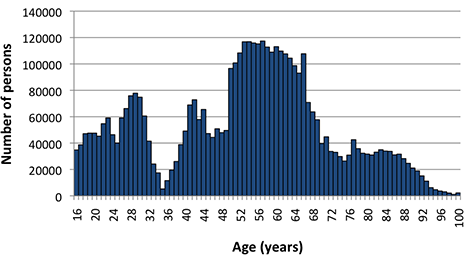
Source: Calculated from ABS, Australian Demographic Statistics, June 2013.
The effect of the ageing of the baby boom generation is illustrated in Chart 4, which shows the change in the number of persons by years of age between 1996 and 2013 (after taking account of deaths and migration). The largest population increase is among fifty- to sixty-six-year-olds, with each year group around 100,000 larger than the comparable group in 1996. Cumulatively, there were 1.7 million more people aged fifty to sixty-four years – the age at which rates of receipt of the DSP start to rise significantly – in 2013 than in 1996.
Between 1996 and 2012 the proportion of people of working age receiving the DSP rose from 4.3 per cent to 5.6 per cent. If the age structure of the population were held constant at 1996 shares, then the figure would be 5.0 per cent – in other words, nearly half of the total increase is unrelated to any changes in the labour market, the incidence of disability or individual behaviour.
More importantly, a series of policy changes from the mid 1990s also had a major impact on the number of people receiving the DSP and other payments. One of the most important of these was the increase in the age pension qualifying age for women from sixty to sixty-five in 1995. Previously, women receiving the DSP were required to shift to the age pension once they turned sixty, and women who became disabled after turning sixty weren’t able to claim the DSP unless they had lived in Australia for less than the ten years needed to qualify for an age pension. As the cut-off age started to increase, women with disabilities in this age group increasingly claimed the DSP. As Chart 5 shows, the proportion rose from close to zero to about 13 per cent by 2013.
Chart 5: Change in percentage of women aged 60–64 years receiving DSP, Australia, 1995–2013
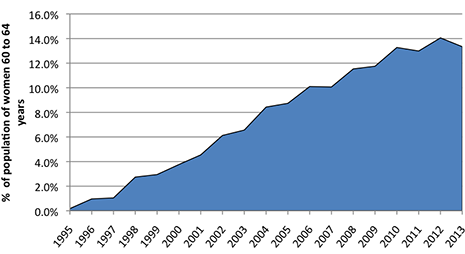
Source: Calculated from Department of Social Services, Income Support Customers, A Statistical Overview, various years and Australian Bureau of Statistics, Australian Demographic Statistics, June 2013.
But as the number of women receiving the DSP went up, the number receiving the age pension went down – and, as Chart 6 shows, it went down by much more.
In 1995, only about 650 women aged sixty to sixty-four received the DSP and 211,000 received the age pension. By 2012, 86,000 female DSP recipients were in that age group, but only 28,000 age pensioners. So the total number receiving one or other of these pensions has nearly halved, and now the majority receive the DSP. Where once 60 per cent of women of that age received a pension, now the figure is 13 per cent.
Chart 6: Percentage of women aged 60–64 years receiving DSP and Age Pension, Australia, 1995–2013
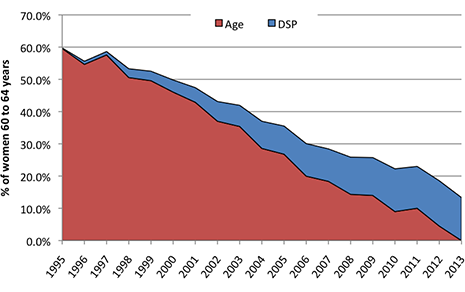
Source: Calculated from Department of Social Services, Income Support Customers, A Statistical Overview, various years and ABS, Australian Demographic Statistics, June 2013.
Starting around the same time, the government began phasing out a number of other payments, including mature age allowances, the partner allowance, the wife pension, the widow B pension and the widow allowance. These payments had effectively been based on the assumption that women were “dependents” of men, or in the case of widows that they had been dependent and should not be expected to look for work. In addition to the phasing out of these payments, the income test for unemployment payments was changed to require both individuals in a couple to claim benefit in their own right, and part of their individual earnings did not affect their partner’s benefit entitlements.
These changes had a profound impact not only on the total number of people receiving welfare payments but also on which payments they received. In the mid 1990s, the “closed payments” – mainly for women – were received by around 4 per cent of the working-age population; now, only 1 per cent of the population receive their successor payments. As with the age pension/DSP trade-off for older women, the rise in the number of people on the carer payment is more than offset by the decline in the number of people on these “dependency” payments.
In future, these two major pressures on DSP numbers – the ageing of the baby boomers and the increase in women’s pension age – won’t operate to the same extent. Because the last of the baby boom generation turned fifty in 2013, the pressure on DSP numbers should start to lessen. As was shown in Chart 4, there were close to 100,000 more fifty-year-olds in 2013 than in 1996, but only 50,000 more forty-nine-year-olds. The younger part of the baby boom generation will not turn sixty-five until 2028, but the rate of increase will slow because the size of the age group is not increasing as rapidly. Moreover, the increase in the pension age for women was also fully phased in by 2013, so this pressure will also decline.
It is worth noting, however, that the previous government announced an increase in the pension age for both men and women from sixty-five to sixty-seven years, to phase in between 2017 and 2023. It is likely that some of the people affected by this change will be entitled to the DSP, leading to an increase in numbers on the DSP after 2017, but past experience suggests that the overall number of people in this age group receiving payments will be significantly reduced.
In addition, the most recent figures for numbers on the DSP show a fall from around 827,000 in 2012 to 821,000 in 2013; excluding people over sixty-five who receive the DSP this is a fall to around 5.2 per cent of the working-age population, about the level it has been since 2004.
What about the unemployed?
Two main factors have driven the growth in Newstart numbers. The number of people receiving unemployment benefits tracks broader labour-market trends fairly closely, and so the increase in the unemployment rate from around 5.0 per cent to 5.5 per cent since June 2012 could be expected to result in around 64,000 more people on benefits. Changes to the DSP under the previous government that appear to have slowed its growth may have increased numbers on Newstart, while policies designed to shift people from parenting payments to the lower level of Newstart payments at the beginning of 2013 have added to the total. The government forecast that around 10,000 people would lose all entitlement to benefits as a result of that decision, and that around 75,000 would transfer onto Newstart. (This effect is the same as the substitution between the age pension and the DSP and carer payment and other closed benefits, as described above.)
The monthly statistics on labour force payments show that between December 2012 and February 2013 the number of people on unemployment payments jumped from around 700,000 to 796,000, an increase around four times as great as the corresponding periods for the previous two years. Moreover, around 83 per cent of the increase in the number of recipients was made up of women, reinforcing the impression that this very large jump is mainly explained by parents transferring from parenting payments.
The monthly figures don’t identify whether beneficiaries have children or not, and the annual statistics won’t show the effect of this policy change on the number of people receiving the parenting payment until next year. Nevertheless, it seems very likely that much of this recent increase will be offset by reductions in numbers on other payments.
Together, the increase in the unemployment rate and the transfers from the parenting payment potentially nearly fully explain the growth in numbers on Newstart.
Where to from here?
To sum up, the data on trends in the number of welfare recipients show a prolonged fall since 1996 due to a long period of economic growth, a strong labour market, and the positive impacts of policy changes since the early 1990s. While trends have not been as positive since 2008, they are far less worrying than in North America or Europe, and they are also mild by the standards of earlier economic downturns in Australia.
This analysis also shows that past trends are not necessarily a reliable guide to the future. The two main pressures on DSP numbers – the ageing of the baby boomers and the increase in women’s pension age – won’t continue to have such a significant impact.
While concerns about relentless growth are difficult to substantiate – particularly when the total number of welfare recipients is close to its lowest level in the past twenty years – we should not be complacent and there are still strong arguments for a comprehensive review of the welfare system. But then there are always strong arguments for reviewing its effectiveness.
The evidence shows that our main concern should be to avoid any significant blow-out in unemployment. The fact that unemployment didn’t rise to levels predicted after the global financial crisis set in means that – so far – we are much better placed to meet the challenges of an ageing population than are countries in Europe or North America. Previous increases in unemployment in the recessions of the 1980s and 1990s had very long-term consequences, particularly for jobless families with children.
Nor should we be complacent because welfare numbers are at their second-lowest level in the past two decades. The minister’s argument that the “best form of welfare is work” has force, and is in accord with the previous government’s rationale for moving people from the parenting payment to Newstart.
The problems that some people on welfare face in moving into work require a comprehensive analysis, however. Not all these problems are caused by the welfare system: other barriers to work include labour-market programs that are not equally effective for all, a lack of job opportunities in the regions in which people live, poor public transport, inadequate and expensive child care, mismatched skills, and negative employer attitudes to people disadvantaged in the labour market. Incentives in the welfare system are only part of an effective response to these barriers.
While most of the aggregate growth in DSP numbers is related to population ageing and transfers of older women from the age pensions, it remains the case that age-specific rates of receipt have risen quite significantly for people under thirty years of age, and this appears to be related to a growing incidence of mental health problems among young people. This problem should also be addressed by the welfare review – but it is difficult see how changes in entitlement to the DSP – compared to more effective mental health services – would be an important part of the solution.
Finally, the wide and growing gap between the level of Newstart benefits and the level of the DSP needs to be reviewed urgently. In fact, those looking for the “unsustainable” and “relentless” elements of the welfare system would do well to start there. •