
OVER the past forty years the economic fortunes of Australian households have fallen into two fairly distinct periods. In the “disappointing decades” of the 1970s and 1980s, to use economist Bob Gregory’s label, real wages stagnated, unemployment increased fourfold and male full-time employment as a proportion of the population fell by 25 per cent. Since 1991, by contrast, Australia has been one of the fastest-growing advanced economies in the world, enjoying twenty-one years of unbroken economic growth and largely escaping the global financial crisis, or the Great Recession as it is still known in Europe and the United States.
Chart 1 shows an index of real median household income based on ABS Income Surveys since 1981–82. For middle-income Australian households, income growth over the first decade was very low, with small gains in the late 1980s lost in the recession of the early 1990s. But it is fair to point out that many other countries had similar or worse experiences; real median incomes in New Zealand, for example, fell 15 per cent in the 1980s.
As Australia’s economy started to recover from recession in 1995, median incomes began to grow, accelerating once the mining boom got under way in 2003. Median household income fell marginally in the period after the onset of the global financial crisis in 2008, but the latest ABS survey shows that in the most recent period, middle-income Australians experienced income growth comparable to the rise before the start of the mining boom.
Chart 1: Trends in real median equivalised household income, Australia, 1981–82 to 2011–12 (1981–82 = 100)
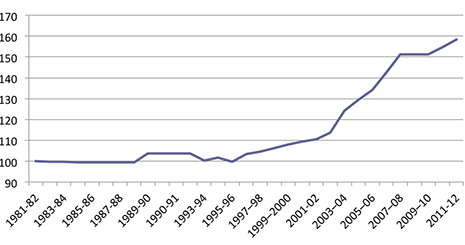
Source: Calculated from Johnson and Wilkins (2006) and Australian Bureau of Statistics, Household Income and Income Distribution surveys, various years.
The benefits of this growth in income appear – at least on the surface – to have been widely shared. Chart 2 shows the pattern of growth for households at different points on the overall income distribution, ranging from households at the tenth percentile (where only 10 per cent of the total population have lower incomes) and for different decile points up to the ninetieth percentile (where only 10 per cent of the population have higher incomes). Although the poorest households haven’t done as well as higher-income households, their real disposable incomes are now more than 40 per cent higher than they were in 1995. Middle-income households are more than 50 per cent better-off over the period, about three times the increase enjoyed by comparable households in New Zealand.
Chart 2: Trends in real incomes at different decile points, Australia, 1994–95 to 2011–12
Cumulative percentage change in real equivalent income-unit income
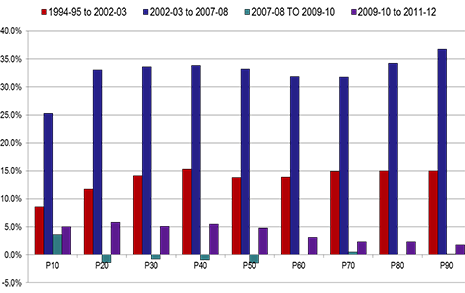
Source: Calculated from Australian Bureau of Statistics, Household Income and Income Distribution surveys, various years.
The growth in incomes for middle-income households in the period leading up to the GFC was the second-highest in the OECD, exceeded only by Ireland. But the richest 10 per cent of Australian households had the highest real increase in incomes of any advanced economy, with the result that inequality grew quite rapidly until 2008. Since then, inequality has reduced a little for two reasons – the age-pension increase in 2009 boosted the incomes of the poor, and the income of lower-income working families grew more quickly between 2009 and 2011 than did incomes among higher-income households.
For most households in Australia, incomes are now higher than they have ever been. Wealth holdings, not surprisingly, reflect similar trends. The most recent Credit Suisse Global Wealth report – prepared by Anthony Shorrocks, one of the most highly respected world experts on wealth distribution – estimated that average wealth in Australia in 2011, at US$397,000, was the second-highest in the world after Switzerland and that Australia’s median wealth of US$222,000 was the highest in the world. This mainly reflects high rates of home ownership. Relative to the rest of the world, very few Australians have a net worth of less than US$1000; this reflects such factors as relatively low credit-card and student-loan debt. The proportion of those with wealth above US$100,000 is the highest of any country – eight times the world average. With 1,861,000 people in the global top 1 per cent, Australia accounts for 4.1 per cent of members of that wealthy group, despite having just 0.4 per cent of the world’s adult population.
The most recent ABS Survey of Wealth and Wealth Distribution shows that average and median net worth dropped slightly between 2009 and 2011, but the changes were not statistically significant. Real median wealth is about 8 per cent higher in real terms than it was in 2005–06. In the United States, by contrast, real median wealth is about 35 per cent lower than in 2005, and median household net worth (including homes) is a bit less than US$67,000, compared to A$434,000 here.
Although it may be unwise for any politician to say it, it remains the case that most Australians “have never had it so good.”
THAT’s not to say that everyone’s income has risen. The ABS income and wealth surveys only provide a series of snapshots of economic resources at different times. Individuals or households at a particular point in the income distribution in one year are not necessarily the same as those who are at that level in other years. Individual incomes are dynamic: even if most people are better-off than similar people in the past, individuals rise up and fall down the income ladder. Young people leave school or university, find jobs and then perhaps get promoted, so their incomes rise over time. Older people start off with higher incomes but may retire or become unwell. And individuals face risks over the course of their lifetime that can have a significant impact on their incomes.
The Household, Income and Labour Dynamics in Australia survey, or HILDA, has tracked a sample of around 13,000 people in 7000 households every year since 2001. It shows how individuals experience a wide range of life events with potentially major implications for their economic status. Around 3 per cent of the population are fired or made redundant each year, for example. Between 1 per cent and 1.5 per cent of the population change each year from being in a couple with children to being a lone parent. Health risks are even more prevalent: around 8 to 9 per cent of the population experience a serious personal injury or illness each year, and around 1 per cent experience the death of a spouse or child.
As a result of these and other life events, around 3 per cent of the population have a major worsening in finances each year. Between 2001 and 2008, between 40 and 50 per cent of Australians experienced a drop in income, and roughly 10 per cent fell more than 20 percentiles in the income distribution. To put this in context, in most income groups an individual who fell 20 percentiles would lose around $200 per week, while a high-income individual who experienced such a fall would be around $500 per week worse off. A couple with children whose incomes dropped from the ninetieth to the seventieth percentile would lose more than $1000 per week.
At the other end of the scale, a relatively low-paid worker might lose his or her job and get a new job at lower pay, moving from the fortieth percentile to the thirtieth percentile. There, they may be better-off than a comparable person was ten years earlier, but their own income would have fallen significantly.
Around half of those in the richest income quintile in 2001 were still in that income group in 2008, but the other half were in lower income groups. Only 30 per cent of those in the middle-income group in 2001 were in the same group in 2008, with 30 per cent worse off and around 36 per cent better off.
As in other rich countries, the main way that Australia cushions the impact of these adverse life events is through its welfare state. Healthcare covers many of the costs associated with sickness, but it is the social security system that deals with the decline in incomes associated with these social risks.
THE increase in household incomes has come in a number of ways, but perhaps the most important has been in the growth in wages and employment after the recovery from the recession of the early 1990s.
With real wage increases low and employment declining, the “disappointing decades” had a profound effect on overall earnings. In the ABS income surveys, the total volume of male earnings in 1995–96 was only 2 per cent higher in real terms than in 1982. The employment-to-population ratio for men fell from around 73 per cent in 1982 to 65 per cent in 1993.
In contrast, total real male earnings increased by 47 per cent between 1995–96 and 2007–08, while total real female earnings increased by 54 per cent. The real increases in earnings for men were greatest in the bottom three deciles and in the top decile; for women, the increase was least for women in the richest 20 per cent of working-age households.
Combined with Australia’s income-tested social security system, rising employment below the median income meant that the welfare safety net contracted during the period of high-income growth. This is only to be expected in a tightly targeted welfare system and reflects the positive labour market outcomes of the period.
Employment growth combined with a series of reforms of the social security system from the early 1990s onwards led to a very large reduction in the number of people of working age who relied on government benefits for more than 50 per cent of their income. As Chart 3 shows, welfare reliance among working-age households fell from 21 per cent in 1996–97 to about 12 per cent just before the GFC; it rose in the subsequent period and fell slightly in the most recent two years. The decline is particularly marked among households just below age-pension age – from 38 per cent in the mid 1990s to just under 20 per cent in the most recent survey.
Chart 3: Change in working-age income support recipients, 1996–97 to 2011–12
Percentage of households with benefits as main income source by age group
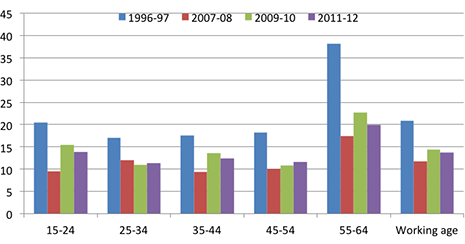
Source: Calculated from Australian Bureau of Statistics, Household Income and Income Distribution surveys, various years.
As the social security system contracted, though, it also became less effective at reducing inequality. As noted earlier, in part this was a reflection of a positive trend – the fall in reliance on welfare payments after 1997. But for people of working age an important factor in this contraction was the decision to link payments for the unemployed to the consumer price index rather than to wages and household incomes, which were rising more quickly. As a result, the incomes of people receiving unemployment payments stayed the same in real terms during a period of unprecedented real income growth.
The effects of this are shown in Chart 4. In the mid 1990s the level of Newstart payments for a single person was close to the single rate of pension for a person with a disability or an age pensioner. After 1996, though, pensions increased at the same rate as wages while Newstart and a range of other allowances remained indexed to prices. As real wages rose, the gap between pensions and allowances widened, and by the time of the most recent survey the single rate of Newstart had fallen to not much more than 31 per cent of median income.
Chart 4: Payments for single pensioner/beneficiary as percentage of median equivalent income, 1994–95 to 2011–12
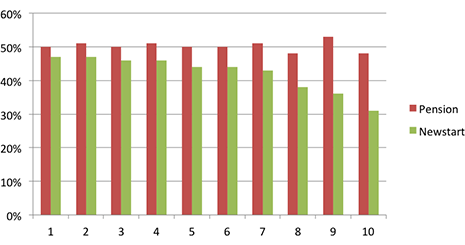
Source: Calculated from Australian Bureau of Statistics, Household Income and Income Distribution surveys, various years.
Many poverty studies use 50 per cent of median income as a relative poverty line, and Chart 4 shows that the unemployed have fallen from just below that line in the mid 1990s to less than two-thirds in 2011–12. The poverty gap has widened and widened.
Put another way, in the mid 1990s a single person receiving Newstart would have been about $10 per week (in current terms) below the tenth percentile of the income distribution, but by 2011–12 he or she would have been close to $160 per week below that percentile. What we are seeing is the continuing impoverishment of the unemployed.
One of the recurrent themes of the recent election campaign was that Australians’ cost of living is “skyrocketing.” While research by NATSEM shows this is far from true, it is true to say that the unemployed are, in effect, living at what were relatively low living standards nearly twenty years ago. If anyone can legitimately complain about cost of living pressures it is people receiving Newstart.
Unless policy changes, the gap can only grow, and working-age social security recipients will fall further and further behind community living standards.
The impact of falling relative standards for Newstart recipients is also likely to be accentuated by the decisions of successive governments to move parents from the parenting payment to Newstart once their youngest child turns six (if partnered) or eight (if single). Single parents on Newstart do receive a higher rate of payment than single people, but the indexation provisions mean that these payments will stay fixed at their current real value and also fall behind any improvement in community incomes.
A very small real increase in Newstart was associated with the compensation package for the “carbon tax,” although pensioners got higher dollar amounts than Newstart recipients, a decision based on the questionable assumption that your electricity bill is lower if you happen to receive a lower Centrelink payment. But it appears that the Coalition government will scrap this income support bonus for the unemployed – but not for pensioners.
On top of that, family tax benefits are now indexed to prices where once they were effectively indexed to wages. As with the indexation of Newstart, the inevitable effect of this relatively recent change will be to reduce the effectiveness of family payments in reducing poverty and inequality.
At a broader level, these and related trends pose the risk of residualising social security recipients and fundamentally changing the nature of the Australian social security system. Although international commentators have characterised Australia as a “residual welfare state,” those more familiar with the Australian situation – such as Frank Castles – have argued that it was more appropriate to view Australia as a “radical welfare state”:
Australian means-tested benefits were not focused on the very poor, but were designed to exclude only the well-off middle classes and the prosperous. Around 70 per cent get the age pension and few people see it as degrading to be a welfare beneficiary… The Australian system of benefits was designed to be as non-discretionary as was humanly possible... There was no issue of whether one was “deserving” or otherwise…
As this quotation suggests, Castles thought this lack of discretion was under threat in the early 2000s, particularly with the extension of “mutual obligation” after 1996. In fact, the introduction of the liquid assets test for Newstart in 1991 could be seen as an earlier stage in this process of residualisation, reinforced more recently by the introduction and extension of income management for some groups.
These shifts also go to the heart of the question of whether income growth in Australia has been inclusive. The rising tide of employment has lifted many but not all boats: a small minority have remained jobless, as welfare recipients, for much of the last decade. While the size of the group in this position appears to have shrunk, its distance from the mainstream has widened.
Each of the policies described above has important goals for which arguments can be made, and some policies may well have positive results for some of those affected. And it remains true that the best form of welfare is to get a job. But not everyone can get a job.
In combination with the downward drift in payment levels for less favoured categories, the social policies on offer from the major parties suggest that working-age welfare recipients are increasingly being seen as the undeserving poor. In effect, we are saying to many working-age recipients that they will never enjoy the future improvements in living standards that the rest of Australia will enjoy. We are also saying this to the children of parents moved onto Newstart.
It’s time to ask whether maintaining incentives to work means that we need to continue to impoverish the poor. •