![]()
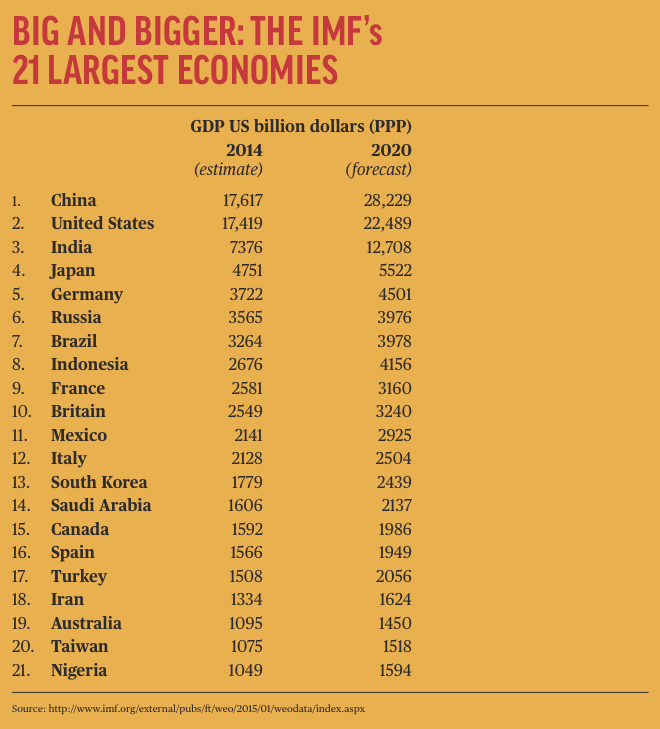
If the International Monetary Fund is right, we can stop speculating about when China will overtake the United States to become the world’s biggest economy. It’s already happened.
The IMF’s new data set, released in April with its latest World Economic Outlook report, estimates that in real terms (corrected for price differences, that is), China’s output in 2014 edged ahead of the United States for the first time. There was little between them: assuming its national accounts are correct, China produced goods and services worth US$17.6 trillion, just $198 billion more than US production of US$17.4 trillion.
But if China’s national accounts exaggerated real growth in 2014 for political reasons, as some suspect, the United States could still be the world’s biggest economy. And if China’s stock market crash presages a bust ahead, it is too soon to say for sure that global economic leadership has changed hands.
The IMF’s future projections assume that China will settle down to a growth rate of 6 per cent while the United States decelerates towards 2 per cent. If that’s right, China will have left its rival way behind by 2020. But, as the events of recent days show, that’s a big if.
The IMF’s latest data set incorporates far-reaching changes to estimates of global GDP based on new estimates of relative prices around the world, prepared by the World Bank’s International Comparison Program, or ICP. The program’s goal was to work out, as best it could, a common measure of buying power in different countries. As an indicator of average prices, the Economist magazine’s Big Mac index compares how much it costs to buy a Big Mac in different countries; the World Bank team does the same thing, but with a vastly wider range of goods and services, sampled at a wider range of locations.
Only when you know what comparable goods and services cost in different countries can you work out what their annual output is really worth. Prices vary too much from country to country, and the vast majority of our spending goes on locally produced goods and services.
It might cost you $15 to see a film in Australia, for example, but only $1.50 to see the same film in India. But the benefit is the same, so the purchasing power parity approach, or PPP, values them as the same. Former senior Australian Bureau of Statistics official Paul McCarthy, who spent years working on the ICP project, sums up: “PPPs are far from perfect, but they’re way better than using flawed methodology like exchange rates.”
The team’s final report, Purchasing Power Parities and the Real Size of World Economies, released last October, indicated startling changes in the ranking order of economies. For example:
• Its new estimates of price levels in China – this time going beyond the big cities to measure prices in the rest of the country as well – implied that China’s real GDP is 20 per cent higher than previously thought.
• India’s real GDP has been adjusted upwards even more, for the same reason: prices across the country, previously unmeasured, are much lower than in the big cities. India’s GDP is a third higher than previously thought, making it easily the third biggest economy in the world – and the one expected to grow most rapidly in the next five years.
• The most stunning changes were in Indonesia. The IMF’s estimate of its real GDP almost doubled after average price levels all over the country were found to be much lower than in Jakarta. On the new estimates, Indonesia is already the eighth biggest economy in the world, and with growth forecast to average 6 per cent, is on track to become the fourth biggest by 2030.
• Since the base year for the World Bank’s estimates was 2011, when oil prices hit their post-GFC peak, oil exporters such as Saudi Arabia, Iran and Nigeria soared up the international rankings. Ranked by GDP per head, five of the eight richest countries were oil exporters; Qatar had a per capita GDP of US$146,521, three times that of the United States (US$49,782).
That last adjustment is likely to be a temporary effect. Oil prices are now roughly half their 2011 levels, so the real buying power of oil exporters’ GDP is far less now than it was then. But if the World Bank team got it right in measuring real prices in China, India and Indonesia, it greatly changes our economic map of the world.
For example, politicians, officials and economists using simple exchange rate comparisons keep claiming that Australia is a bigger economy than Indonesia. Not so, the ICP reveals: it’s just a much more expensive one. In 2011, the overvalued dollar crippled Australia with an average price level 56 per cent higher than in the United States; Indonesia’s price level was 59 per cent lower than in the United States.
In real terms, Indonesia’s annual output in 2011 was two and a half times Australia’s output. Paul McCarthy, who worked on the Asian price measures, is confident that these estimates are in the right ballpark. Our delusions of grandeur will need to face up to this newly revealed reality.
The IMF estimates that the global financial crisis saw the developing countries as a group produce more than half of the world’s GDP for the first time. By 2020, it forecasts, they will produce more than 60 per cent of it. China’s crisis may slow that historic transition, but it will not reverse it. •